The best I can do to summarise the complex subject of secular ‘Sea Level Rise’ (SLR) is to start with Wikipedia (note that here, we define time as BP, ‘Before Present’, i.e., with a 1950 year shift compared to BC):
“eustatic sea level has fluctuated significantly over the earth’s history. The main factors affecting sea level are the amount and volume of available water and the shape and volume of the ocean basins. The primary influences on water volume are the temperature of the seawater, which affects density, and the amounts of water retained in other reservoirs like rivers, aquifers, lakes, glaciers, polar ice caps and sea ice. Over geological timescales, changes in the shape of the oceanic basins and in land/sea distribution affect sea level. In addition to eustatic changes, local changes in sea level are caused by the earth’s crust uplift and subsidence.”
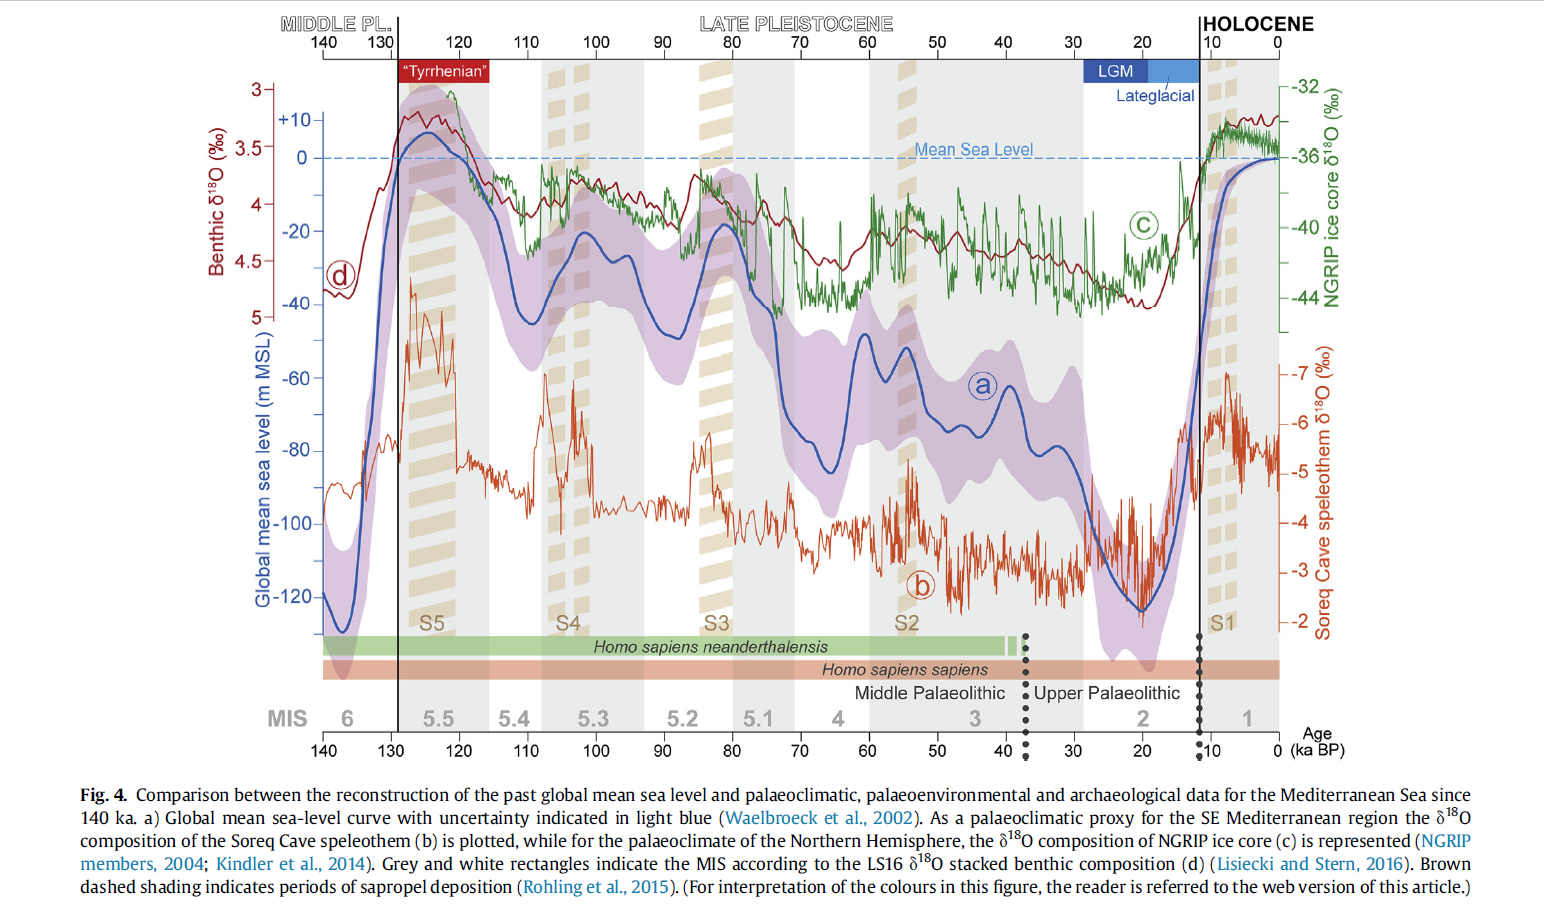
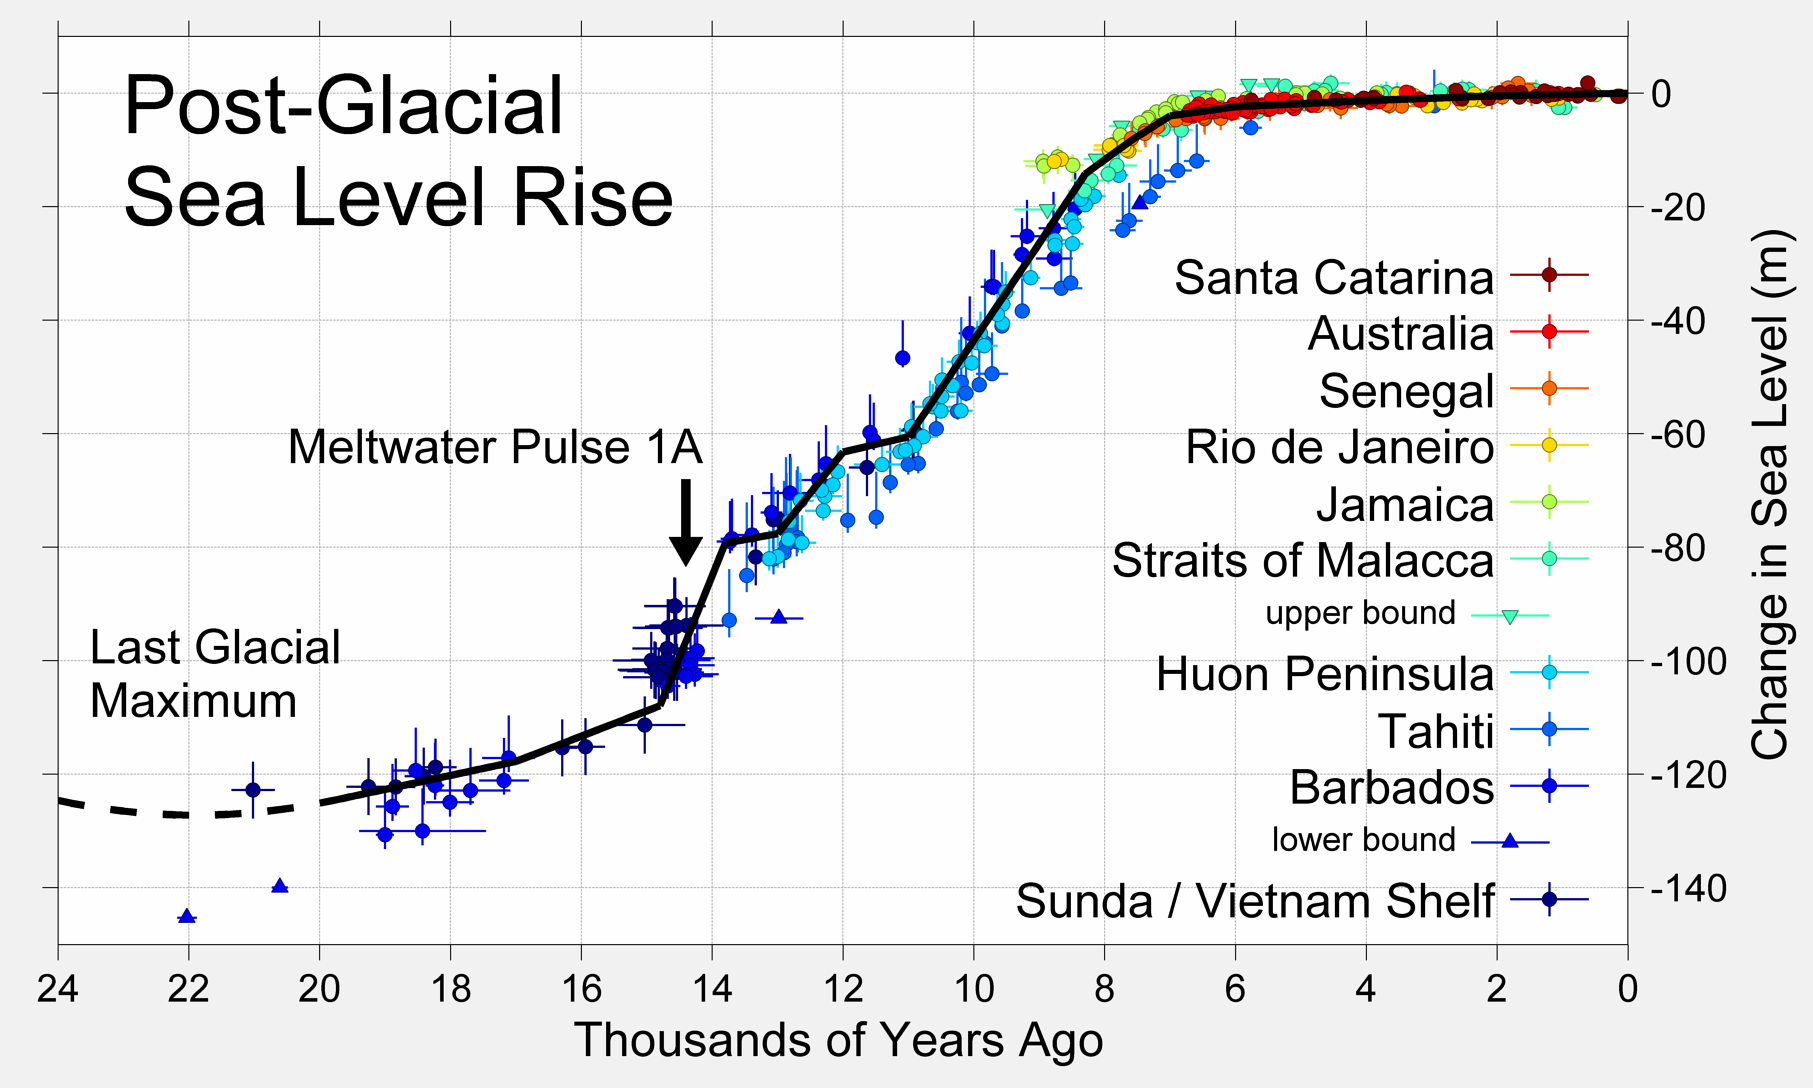
During the last glaciation, between ca. 125 000- and 20 000 years BP, the Mean Sea Level (MSL) fell from a level slightly higher than today (+ 5 to 10 m[0]) to ca. -120 m (blue line with uncertainty margin shown in violet). The average drop in MSL over the last glaciation was therefore around 1 mm/year, but it was a rather discontinuous process, even though stable periods of say 1000 years may have occurred.
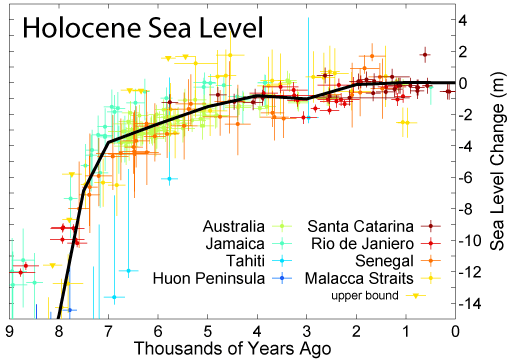
Let’s zoom in on our Holocene period (from 12 000 BP to the present day) to see that the MSL rose quite rapidly to -4 m below today’s MSL, ca. 7000 years ago, and much less thereafter.
Many studies were conducted in recent decades to evaluate past SLR and to predict future eustatic SLR for the next century(s). The best known is the work of Kevin Fleming (1998)[1]. To make it short, the results are as follows, in round figures:
- Predicted for the 21st c.: around 5 to 10 mm/year, and more
depending on prediction model used;
- Observed in the 20th c.: around 1 to 2 mm/year;
- Observed in the past 2 000 years: around 0.25 mm/year,
resulting in ca. 0.50 m SLR over this period;
- Observed between 7 000 and 2 000 BP: around 0.7 mm/year,
resulting in ca. 3.50 m SLR over this period;
- Observed between 15 000 and 7 000 BP: around 14 mm/year,
resulting in ca. 110 m SLR over this period.
These figures are in accordance with work of Nic Flemming (1973 & 1986) who was the forerunner on this subject and with Christophe Morhange (2013)[2].
According to Sivan (2001), “local sea-level curves reflect global eustatic changes, regional isostatic adjustments of the crust to changing ice and ocean volumes, and tectonically controlled crustal movements”. For this reason, we call them Relative SLR (RSLR), and it is obviously difficult to differentiate eustatic SLR from crustal movements of the earth as our measuring instruments are placed on the earth. A rough first approximation would be to consider that both water and earth crust are moving independently, so that the average of all measured sea level movements on the entire Mediterranean basin would reflect the eustatic SLR, while local deviations from this average would reflect the local crust movements (e.g., Crete). If this simple method is applied to Nic Flemming’s data base, including over 400 Mediterranean coastal sites inspected by him, we find an average eustatic SLR ranging between 0 and 1 m over the past 2000 years. This approach is theoretically incorrect as we know that when the sea level rises, water comes onto dry land which will subside due to the new load of water, depending on the underlying geology. Hence, water and land are not moving independently, and we need more complex modelling of the interactions between the two[3]. It might then possibly be found that most, if not all, of the RSLR over the last 2000 years is due to crustal movements.
Since the rise of human civilisations around 7 000 BP, eustatic SLR has been around 4 m. This value must obviously be combined with local crustal movements which may have reached several meters uplift (e.g. Phalasarna in western Crete) or subsidence (e.g. Alexandria, Apollonia Cyrenaica, Portus Iulius, Rome, and many others) and sometimes both (Pozzuoli near Naples). Note that eustatic SLR is a fairly continuous phenomenon that may be expressed in mm/year over specific period of time as in the table above. However, crustal movements may be much more hectic (e.g., during earthquakes) and can therefore not be expressed in mm/year. Hence, the Relative SLR should not be expressed in mm/year. This RSLR was estimated from the vertical position of coastal structures such as quay-walls, quarries and fish tanks, of horizontal rims of biological material, of beachrock alignments, and of tidal notches. Fish tanks and biological rims are more accurate indicators of RSLR than port structures because of the uncertainty of the latter’s “functional height”. However, the precise dating of these indicators is often a problem[3a].
As an example, let’s take the area of Rome, over a period of 2 000 years, studied in detail by Goiran (2009)[4] based on an analysis of marine shells, and by Lambeck (2018)[5] based on an analysis of coastal fish tanks. The first concludes with a relative SLR of 0.8 m, and the latter with 1.22 m, hence both are quite close to 1.0 m. This relative SLR is thus composed of 0.5 m eustatic SLR + 0.5 m crustal subsidence.
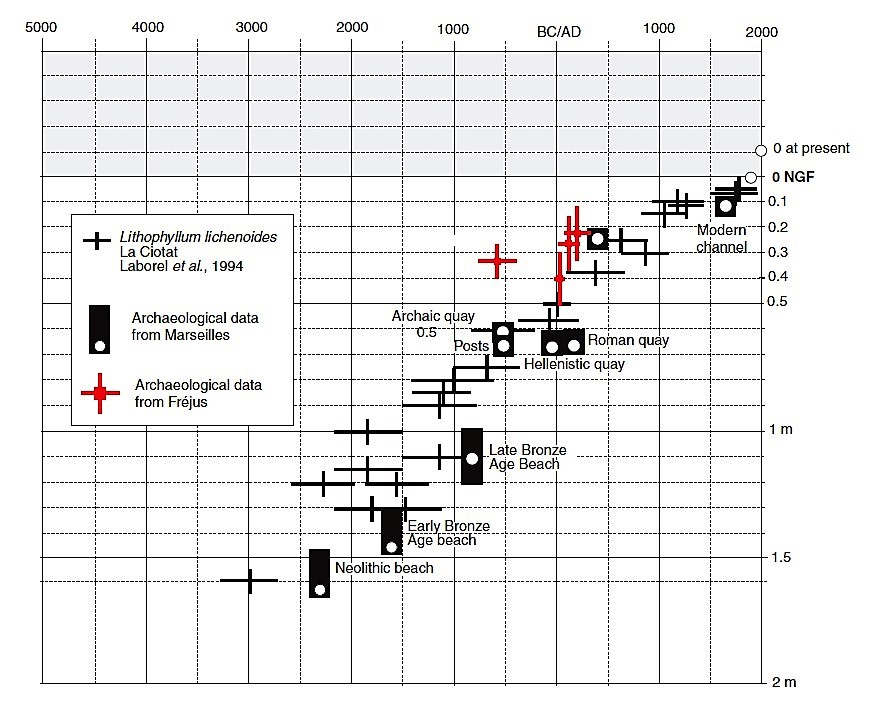
Another interesting case is given by Morhange (2013) who shows that the relative SLR of 0.5 m in 2 000 years in Marseille-La Ciotat-Fréjus equals the eustatic SLR because no significant crustal movements occurred in this area during several millennia.
However, work published by Yasur-Landau et al. (2021)[6] shows a quasi-stabilisation of the sea level along the Carmel coast between 3800 and 2200 BP (ca. 1800 BCE to 200 BCE) which was followed by a rapid sea level rise during the Roman period (say 200 BCE to 300 CE) and another quasi-stable sea level after that. This had deep historical consequences, as Bronze Age and Iron Age cultures could live near coastlines without fear of sea level rise, while Hellenistic and Roman cultures were faced to sea level rise (Yasur 2024; Gambash 2024)[6a].
Only few tectonically stable areas have been identified so far: southern France between Narbonne and Antibes (except for the Rhône delta), the western Sicilian coast, many places along the southern Turkish coast, the Southern Levant, the Byzacene coasts (perhaps extending to Djerba, Sabratha and Leptis Magna), around Tangiers, and possibly the Baleares, and Vis and Bisevo islands in Croatia[6b].
A more controversial case is the Black Sea. It is accepted that it was once a fresh-water lake disconnected from the Mediterranean Sea by a sill in the Bosphorus located around -36 m below present sea level (deepest spot of the shallowest cross-section in the Bosphorus located in front of Dolmabahçe Palace).
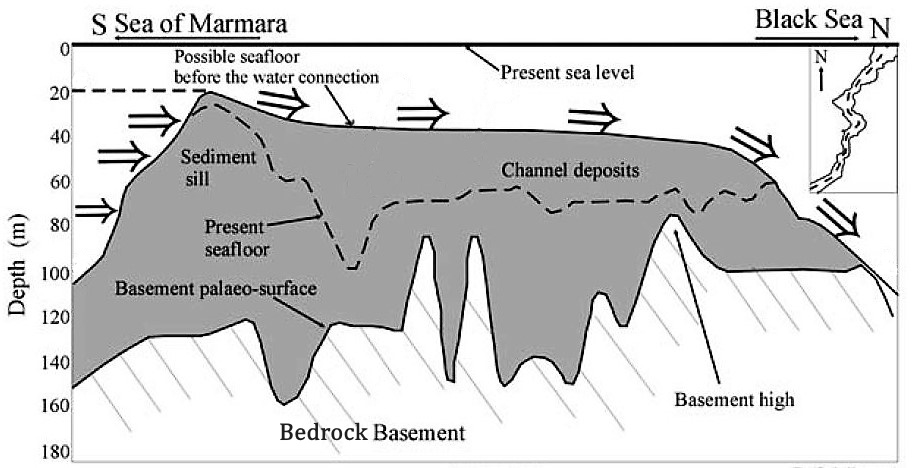
This configuration existed until around 8700-8500 BP when, due to global eustatic SLR, Mediterranean water started to flow over the sill into the Black Sea-lake[7a]. The questions are: how deep was the lake water level at that time, and how fast did the water level rise? Even if the lake water level was much deeper than the Bosphorus sill, e.g. -80 to -100 m acc. to Yanchilina (2017)[8], flooding must have been rather progressive because, as mentioned above, global SLR was around 14 mm/year[9] … unless the sill in the Bosphorus collapsed, perhaps during an earthquake (more on this subject).
In any case, scholars agree on the fact that after reconnection with the Mediterranean Sea, the Black Sea water level followed the global eustatic SLR. This means that Neolithic and Bronze Age settlements were not affected by the controversy about the Black Sea water levels, i.e, Neolithic settlements dated around 6000-3000 BC might be found down to 15 m depth below the present sea level.
References
[0] Mauz, B., et al., 2020, “MIS 5e sea-level proxies in the eastern Mediterranean coastal region”, Earth System Science Data, 357, (22 p).
[1] Fleming, K., et al., 1998, “Refining the eustatic sea-level curve since the Last Glacial Maximum using far- and intermediate-field sites”, Earth and Planetary Science Letters 163, (p 327–342).
Spada, G. & Melini, D., 2023, “New estimates of ongoing sea level change and land movements caused by Glacial Isostatic Adjustment in the Mediterranean region”, Geophysical Journal International, Vol. 229, Issue 2, May 2022, (p 984-998).
[2] Flemming, N.C., Czartoryska, N.M.G., Hunter, P.M., 1973, “Archaeological evidence for eustatic and tectonic components of relative sea level in the South Aegean”, 23rd Symposium of the Colston Research Society, Bristol, 1971, Pap. 23, (p 1-63).
Flemming, N.C., Webb, C.O., 1986, “Tectonic and eustatic coastal changes during the last 10,000 years derived from archaeological data”, Z. Geomorphol. Suppl. 62, (p 1–29).
Sivan, D., et al., 2001, “Holocene sea-level changes along the Mediterranean coast of Israel, based on archaeological observations and numerical model”, Palaeogeography, Palaeoclimatology, Palaeoecology 167, (p 101-117).
Morhange, C., 2013, et al., “Relative Sea-Level Changes During Roman Times in the Northwest Mediterranean: The 1st Century A.D. Fish Tank of Forum Julii, Fréjus, France”, Geoarchaeology: An International Journal, 28, (p 363–372).
Kayan, I., 2019, “Holocene Sea Level Changes and their Geoarchaeological Impacts on the Aegean Coast of Anatolia”, TINA, Maritime Archaeology Periodical, 2019:12, (p 11-35).
Yasur-Landau, A., et al., 2021, “New relative sea-level (RSL) indications from the Eastern Mediterranean: Middle Bronze Age to the Roman period (~3800-1800 y BP) archaeological constructions at Dor, the Carmel coast, Israel”, PLoS ONE 16(6): e0251870, (25 p).
[3] Spada, G. & Melini, D., 2023, “New estimates of ongoing sea level change and land movements caused by Glacial Isostatic Adjustment in the Mediterranean region”, Geophysical Journal International, Vol. 229, Issue 2, May 2022, (p 984-998).
Lambeck, K. & Purcell, A., 2005, “Sea-level change in the Mediterranean Sea since the LGM: model predictions for tectonically stable areas”, Quaternary Science Reviews 24, (p 1969–1988).
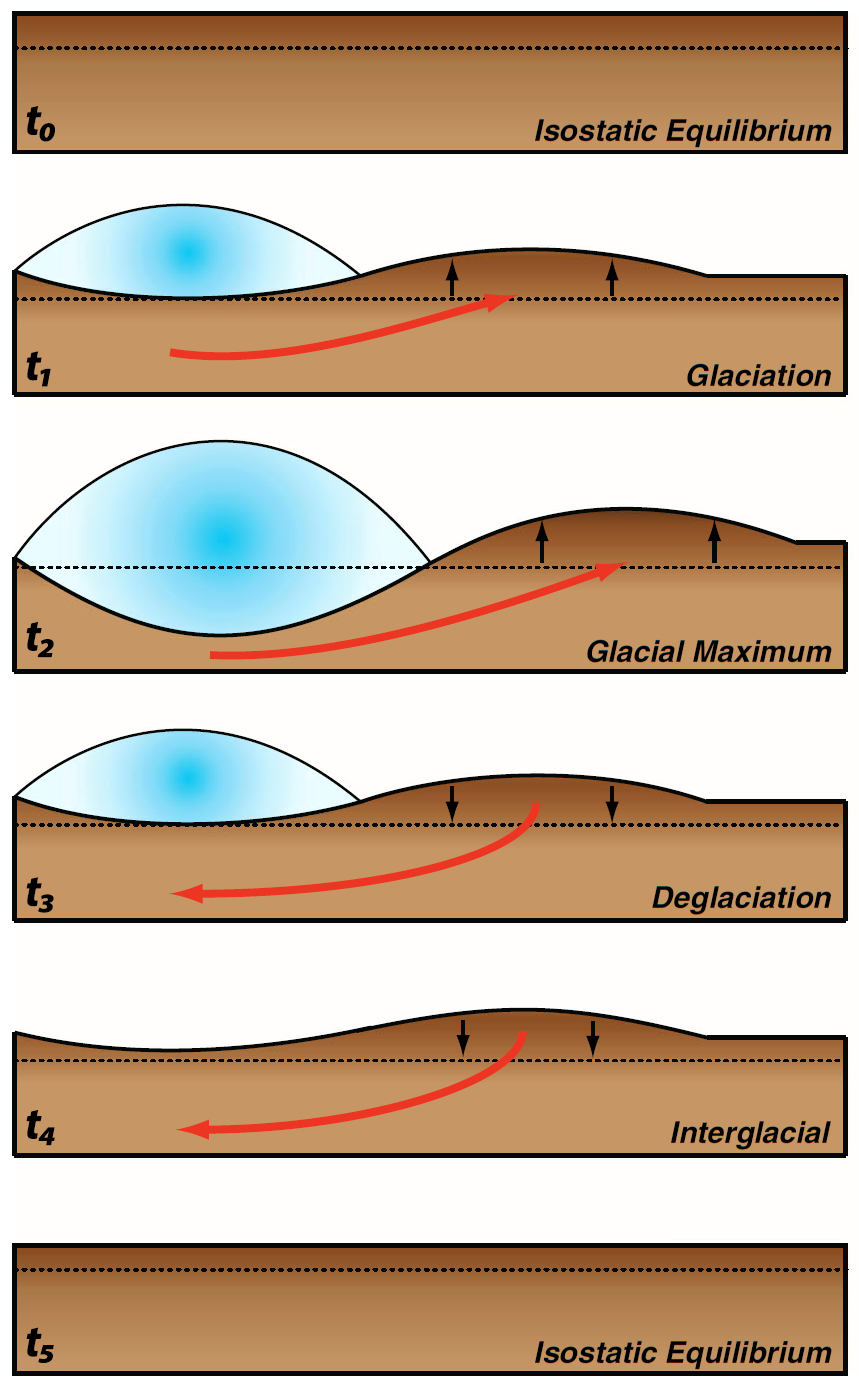
The earth’s crust and mantle are reacting like a mattress, on which some areas have been relieved of the weight of ice layers, and others have been loaded with an additional layer of meltwater. RSLR therefore consists of a rise in sea level interacting with ground subsidence. This process is part of the Glacial Isostatic Adjustment (GIA).
[3a] EVELPIDOU, N., & KARKANI, A., 2019, “Archaeology and Sea-Level Change”, in: Encyclopedia of Coastal Science, Springer, (7 p).
[4] Goiran, J-P., Tronchère, H., Collalelli, U., Salomon, F., Djerbi, H., 2009, “Découverte d’un niveau marin biologique sur les quais de Portus : le port antique de Rome”, Revue Méditerranée, 112 | 2009, (online), (10 p).
[5] Lambeck, K., Anzidei, M., Antonioli, F., Benini, A., Verrubbi, V., 2018, “Tyrrhenian sea level at 2000 BP: evidence from Roman age fish tanks and their geological calibration”, Rendiconti Lincei. Scienze Fisiche e Naturali, Satellite Geodetic Positioning for Geosciences, Roma, 2017, (12 p).
[6] Yasur-Landau, A., et al., 2021, New relative sea-level (RSL) indications from the Eastern Mediterranean: Middle Bronze Age to the Roman period (~3800–1800 y BP) archaeological constructions at Dor, the Carmel coast, Israel, PLoS ONE 16(6): e0251870.
[6a] Yasur-Landau, A., et al., 2024, Sea-Level Changes and the Location of the ‘Missing’ Hellenistic and Roman Harbours at Tel Dor, Israel, Int. J. Naut. Archaeol., 53, 1–20.
Gambash, G., 2024, To Build or Not to Build: Considerations of Coastal Development in the Ancient Southern Levant, J. Mar. Sci. Eng., 12, 803, 1-12.
[6b] Vacchi, M., et al., 2016, “Multiproxy assessment of Holocene relative sea-level changes in the western Mediterranean: Sea-level variability and improvements in the definition of the isostatic signal”, Earth-Science Reviews 155, (p 172-197).
[7] Gökaşan, E., et al., 2005, “Evidence and implications of massive erosion along the Strait of Istanbul (Bosphorus)”, Geo-Mar. Lett. 25, (p 324–342).
[7a] Hristova, R. & Peev, P., 2014, ‘’Sea level rise and human adaptation to environmental changes during the late prehistory along the western black sea coast’’, Comptes rendus de l’Académie bulgare des Sciences, Tome 67, No 5, (p 693-698).
[8] Yanchilina, A., et al., 2017, “Compilation of geophysical, geochronological, and geochemical evidence indicates a rapid Mediterranean-derived submergence of the Black Sea’s shelf and subsequent substantial salinification in the early Holocene”, Marine Geology, 383 (2017), (p 14-34).
[9] A simple hydraulic computation with a sill at -36 m shows that this global SLR would induce a rise of the Black Sea level (from -90 m) within around 200 years, inducing a gradually increasing SLR in the Black Sea not exceeding 1 m/year. This is fast, but it is not a catastrophic flood. The « deluge hypothesis » can only be explained by collapse of (a part of) the Bosphorus sill. Further details and hydraulic computations are provided in the section on “The Bosphorus“).